Thursday, July 22, 2010

Looks Like Monday

Was Tuesday's bull pop just a one day wonder? We're about to find out trader buddies. The catalyst for Wednesday's swoon of course was Bernacke's gloomy comments that hit the markets like a surface to air missile. Tuesday evening Don Worden had proclaimed the day's action a classic one-day-reversal portending bullish things to come. Wednesday's night comment referred to it as a "fluke", with the odds now favoring the bears. Go figure.
Some readers have questioned my recent focus on currencies more so than stocks/ETFs and my response to that is that although I'm old I'm adaptive and follow the path of least resistance and greatest clarity.
For those that have followed the BZB Currency Rotator you may have noticed that the model's # 1 rank was correctly positioned 45 days in a row February to March. There's been a few stumbles along the way but from a risk management standpoint I'm finding currencies more technically consistent that equities and easier to forecast.
On Monday's close Project Z generated a BUY signal on UUP and a SELL signal on FXE. I prefer to run these 2 studies separately rather than as a pair trade just to see if the divergent signals confirm one another and I don't enter the trades intraday if price is moving against me. As a result I entered the trades late at Tuesday's close as the signals fired again. So far so good . . with 6 days to a fixed bar exit unless that 1/3 ATR stop fires on either position.

Wednesday, July 21, 2010

The GDX Situation

Tuesday's action offered some surprising strength on both GDX and XLE following my bearish prognosis for both on Monday. Looking at the Gold Rotator components we see a mixed bag of 5 day price trend and an overwhelming negative Moneystream values with the stocks NEM and AU leading the pack. Most all the components are running 50-65% of volume surge although NEM and EGO are showing some high 80s% potential reversal volume patterns.
Virtually all gold components are displaying virtually identical technical patterns and look to be coming off a recent W support formation. Better odds for Longs may kick in once technicals cross above the MACD zero line and a short term uptrend is confirmed.


Tuesday, July 20, 2010

Currencies at a Glance

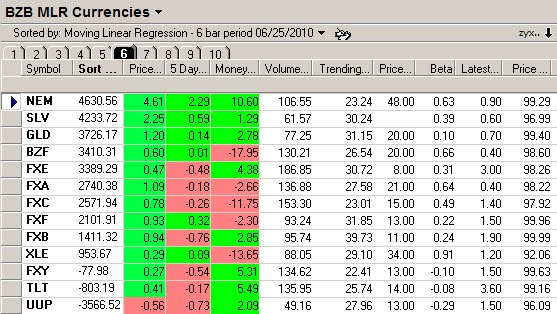
Returning to the typical 2 day bar sort of the Currencies we note the yen is actually holding up better than its counterparts while the dollar exhibits the lowest MoneyStream value, initially suggesting more weakness to come although the technicals are arguing for a consolidation and/or bottoming formation.
The big volume movers were the yen, Aussie dollar and the euro. Largest short interest ratio now resides with TLT, closely followed by the euro.
Of some note: XLE is riding a downtrend with the next intermediate support level around $50, some $2 below current levels. In similar manner GLD is drifting in a downtrend with intermediate support around $110, over $5 below it's current level.
Monday's action on the majors was clearly mixed with the financials, especially BAC, still showing pervasive weakness. The low volume creep Monday felt a lot like the earlier low volume melt up that preceded Friday's plunge and, while earnings reports continue to drive short term momentum, sell side programs continue to overshadow intraday dynamics.

Monday, July 19, 2010

On Edge

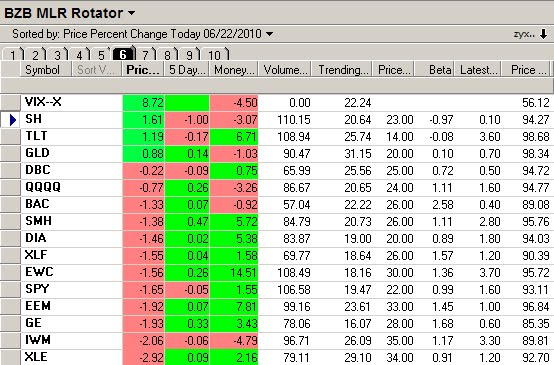
You don't need a weatherman to tell which way the wind blows . . Bob Dylan said that. Technicals don't look good . . I said that. In a departure from my usual 2 day bar sorts which tend to buffer short term momentum the above sort of Friday's action is straight up daily bars. Keep in mind that the VIX marches to a different drummer than stocks and ETFs because it's a statistical value, not a tradeable equity.
Items of note on the sort include:
1. Volume surges in TLT & SH, while GLD has dropped to almost 50% normal volume.
2. Lowest short interest ratio continues to reside in SH, which some believe is bullish.
3. The majors are red in all 3 lead categories. (I'm discounting SPY 5 day value of .01)
4. And, if you want to get nervous, take a gander at the weekly and monthly charts of the majors. They all look poised to plummet off the chart. Now, I don't want to be discounted as one of the doom and gloom prophets . . because starting from my current flat position I just follow the market lead up or down . . I've no preset bias either way.
Unfortunately there's lots of folks with big bucks tucked away in their IRAs in the form of mutual funds (I have no idea why anyone would still own a mutual fund with all the great ETFs available that can be opened or closed in a few seconds without waiting for the end of day to execute). Those monies will be at risk if we do get a real drop and, if nothing else, maybe picking up some SDS or SH to at least get neutral until the danger has passed and we get back to an uptrend should be considered. Better safe than sorry . . you know me. . . always trying to look out for my vast readership and loyal subscribers.
Finally, a little item that may get your attention. As part of my Telechart Gold subscription I receive the nightly Worden Report which is sometimes dead on and other times wildly off the mark, and I make no warranty as to the reliability or tradability of the attached report. Worden Bros. have been at this for something like 30 years (I've had a subscription for 24 years) and they see the markets through their own technical lens and forecast accordingly. A robust and versatile suite of technical tools at a rock bottom price IMHO. Of course this report is copyrighted material but if you go to http://www.worden.com/ you can get a free 30 day subscription, so I'll just assume all my readers will do that and keep me out any legal trouble.

Friday, July 16, 2010

The Pain Machine

The TLT did show it's stuff today as the VIX executed the runup forecast earlier in the week. The afternoon session was divergent with both the SSO and VIX maintaining a downslope on 5 minute bars. Surprisingly, with an average downturn of over 2.5 % in each of the majors, the NYAD never got below .18. Selling of this virulence is typically accompanied by NYAD levels more around .10 and a preliminary conclusion to be drawn is that there more downside to come. The biggest volume day in BAC since May reflected a 9% loss while most of the financials including XLF saw +/- 4% hits . . with the glaring exception of GS, which was actually up 2 % at one point before plunging into the close.
Monday could be a doozey and I'm glad to have both oars in the boat and flat at the close.

Thursday, July 15, 2010

A TLT Turn?

A late post today as some updating problems with TC delayed my efforts to alert my readers to developing conditions. OK . . there may be a bit of hyperbole there, but on the daily bars it sure looks like TLT is undergoing a change of character to the upside, perhaps in conjunction with a rising VIX.
Note that the highest volume surges were in TLT and SH today, while GLD showed only 50% of typical volume.
Also of note: the current short interest ratio on the SH is the lowest of the bunch . . by a huge margin.

Wednesday, July 14, 2010

Mid Week VIXology

Now that the excitement's over for AA and INTC I thought this might be a good time to see how the VIX was doing longer term . . in this case on daily (above) and 65 minute bars (below).
OK .. a little aside here. I keep mentioning the use of 65 minute bars in lieu of 60 minutes (hour) bars because there are 390 minutes in the trading day and 60 doesn't go into 390 very well, while 65 (or 130) fits very nicely. Now, in the process of bringing Project Z to the market in the forthcoming ETF Prophet site, one of my loyal trading buddies tested the SSO/TLT model using both 60 and 65 minute bars. The results are pretty amazing, with the 60 minute model showing a flat equity curve, while the 65 minute version was a true thing of beauty with a continuously upslope equity curve. Now that analysis applied only to the modified z score algorithm that drives Project Z, but let me just suggest that system traders working on hourly bar signals may do themselves a favor and try 65 minute bars for a performance comparison.
And now, the VIX. I've drawn some whimsical support and resistance lines on the daily chart, supporting an otherwise completely non-technical view that the VIX's next move will be UP. The 65 minute chart kind of leans in that direction also although we have to temper any enthusiasm with the realization that the VIX tends to behave oddly during the final days preceding expiration, as was noted in yesterday's post and as is evident in today's action on the 2 minute bars.
We're seeing the rollers turn red as of this post and I'm off to Coronado to visit some friends and play a few holes so I won't be around to see today's closing. I will mention in conjunction with the Tuesday INTC report that I have a deep pockets trader buddy who places one trade religiously every quarter. He shorts INTC afterhours on positive earnings reports and then dumps the stock either at the open or throughout the next day. This simple lay in wait tactic has netted him a substantial nest egg over the years and bears closer scrutiny for those interested. I ran the same game with EK for years with equally high probability results. . . although EK isn't the market force it used to be and now that game is more like chasing water down the drain.

Tuesday, July 13, 2010

Surge Continues

A strong day with the NYAD showing some of the best and most persistent intraday strength seen in months. After hours INTC's most profitable quarter in a decade report has that stock up $1.50. Many of the techs have followed suit after hours. . CSCO is up .50, as are the Qs. The last hour surge pushed most issues past the R2 resistance level and reflecting the technical confusion that typifies expiration week, the VIX was up also . . strangely rising as the SPX made surges almost perfectly on the half hour . . and you though the markets were random.
A lot of traders were waiting for the INTC numbers before fading this rally, but based on the breath of this current rally it's probably a bit early to get short. A revisit to the April highs would be a great shorting opportunity.

Monday, July 12, 2010

A Little Pause

Monday's markets produced mixed results on thin volume as traders waited out the AA earnings report. After hours prices are up substantially, reflecting AA's positive report and probably looking forward to INTC's Tuesday report.
All of a sudden gold has a stigma and the popular press is making the sign of the cross whenever its stability is mentioned. HEY!. Things change.
Remarkably, virtually all the currencies are in the red although this was the data field at the close and after hours XLE is showing green, perhaps in anticipation of a BP capping success and disposal of assets. Tread lightly on that one IMHO.
The NYAD was upslope most of the day although it closed at a decidedly bearish .55 value.
Finally, as a follow up to last week's comments about a fundamental change in market dynamics induced by HFT, I enclose two ZH links, here and here that may help to clarify some of the issues at hand.
And, for those wanting to try their hand in this new milieu OEC offers a variety of tools for futures traders.

Thursday, July 08, 2010

The Leader Board

WOW!. . . 3 up days in a row.
OK. . this reminds me of a parallel and I must digress. . . .
I lived in Seattle for 35 years and for those that have spent any time there you know that July through September can be absolutely beautiful . . trees are in full bloom and the air is rich with invigorating oxygen. The sun shines almost every day and it's a great place to be outdoors. Unfortunately, that paradise is typically short lived and Fall often ushers in an almost permanent condition of overcast gloom, occasional drizzle and chilly winds. This situation persists through the winter months, frequently accented by driving rains and snow storms with temps is the 20s and low 30s. After 5 or 6 months of this many folks tend to aberant and/or suidical behavior as vitamin D deprivation begins to effect thier brain chemistry. And then the sun finally appears in the Spring and people emerge from their self-imposed cave-like existence, step out into the street and stare into the sky at the golden orb whose existence they had almost forgotten.
Such is a prevalent attitude among some bloggers following these past 3 days who claim that the low of the year is now in. And they may be right. BUT . . I seem to recall an old theory of pain management applicable to trading that says traders will look for the first opportunity to dump risky positions once they have reached a breakeven point or if it apears that recovering positions are poised to plunge again. That point is of course different from trader to trader depending on their entry point, but a likely baseline would be the LR30 upper channel line. . . a level that has now been reached on many of the majors this week.
So while these markets may have a bit more room to run, I'm not that encouraged by the post July 4th low volume melt up. Earnings reports may be the catalyst that drives the markets over the next 2 weeks and by most accounts the early reports have been mixed. Now a little caveat: If you've learned anything over the past 3 months it should be that this market is fickle and it can change direction in a heartbeat. I sincerely believe that the past quarter has placed traders in an entirely new paradigm, driven and manipulated by HFT and masking programs much more that anyone including the SEC would care to admit. Now, I'm not a conspiracy nut . . but if you watch the markets every day on 2 minute bars you would have noticed that market dynamics are not what they were last Fall and I believe there are profound reasons for that change . . which I'll explore in upcoming posts as time permits. In the meantime, the New Approach coupled with the Market Prognosticator is the best revenue stream I can find.

Wednesday, July 07, 2010

VIX / TLT VIXENS

Thanks for the emails regarding my New Approach post with suggestions for further improvements. It's nice to know that some folks are trading variations of this setup every day even though it may be formatted on a different platform. As Clueless pointed out . . why trade the Qs at $43 when you can trade SSO at $33 with twice the beta? Of course you could trade the QID ultrashort Qs at $19 with the same beta although some brokers classify the the QID as HTB, making shorting the QID difficult . . and the ultralong QLD is $51, so I still think the SSO/SDS pair is the best value play.
Here's a variation of the 5 minute chart setup using SSO/VIX on the left and SSO/TLT on the right. It might surprise you learn that applying the VIXEN crosses setup to SSO with TLT in lieu of VIX actually produces about a 7% performance improvement while reducing net drawdowns similarly. The downside to using a TLT based VIXEN is that it tends to lag the VIX signals and as a result the total net gain is reduced a bit. That's the tradeoff . . increased reliability for reduced net gains.

Tuesday, July 06, 2010

Dump the Whopper

The good news is we got an explosive up open on Tuesday. The bad news is that this may well be just another one day wonder, resolving the extremely oversold nature of most markets and setting up a series of further nasty plunges.
I may be old but I'm slowly learning the new paradigm . . sell all gap up opens. This is especially true when we get whoppers NYAD pops like Tuesday where the opening value of the NYAD was 18.20. Please . . a little tough love here . . if you don't realize the extreme inflation of such a value then you need to study the markets a little more. The odds of this number be sustained for even a few minutes is close to zero. And, as confirmed by the end of the day results, the NYAD had fallen to 1.08, an essentially neutral value.
I picked up a number of longs on Friday with the idea that most of the big traders would be selling risk at Friday's close over the long weekend. Of course then I fretted over the weekend that Tuesday would be another doozey down day and I'd be a bit poorer . . and Monday night's down futures didn't improve my mood.
But lo and behold, Tuesday gapped up big and I couldn't sell everything fast enough, finally getting 100% cash 30 minutes in. I left a few bucks of opportunity cost on the table with my long SSO calls and BAC, having bailed on them a smidgen too early, but dumping WMT at 49.21 was a gift.
Sometimes you just get lucky . . . and that's exactly what it was. I've got no illusions about being a forecasting wizard . . the whole scene could have gone the other way in a heartbeat . . don't kid yourself . . this is an ugly and scary trading environment.
Oh yeah . . TLT is back in the lead again.

Friday, July 02, 2010

A New Approach

It's easy to be pissed off and frustrated by the HFT manipulation of the markets that has become commonplace. Unless you've been trained as a jet fighter pilot like some of my trading buddies your reflexes just can't keep up with the intraday big bar trend reversals that have become the new paradigm for daytraders.
There's still the standard benchmarks for traders like the pivots that continue to provide valuable intraday reference points and, perhaps interestingly, I've noticed that the pivots appear to have become even more reliable as stop and reverse or stop and rest points than they have before. This may have to do with the nature of some of the preset risk management controls embedded in many of these HFT programs, because once the pivots are violated the volume surge typically accelerates substantially.
Now, you know me . . I'm always looking for a better mousetrap, or in this case an easier mousetrap.
I've been following the recent developments of my trading brother in arms the Clueless Q Trader, who shares my underlying fascination with the Qs as a trading vehicle. Clueless has now migrated a goodly portion of his daytrading over to the SSO and, as I pondered and examined this development, it's simple brilliance struck me.
I've often said that if I could just trade the NYAD, life would be a breeze. Of course the NYAD is just an indicator reflecting the relative NYSE advancers versus decliners. BUT, the SPY is a perfect mimic of the NYAD . . you'll never see any significant divergence between the SPY and the NYAD. Using the SSO just doubles the beta. . voila!!.
Thus my new trading platform setup as shown above to capture those SSO moves. This is the Schwab SSPro platform and includes just 4 charts . . SSO/VIX, VIX/NYAD, NYAD/VIX and TICK. In between the charts are 3 dynamic scrollers that display the new highs and lows count of the day for the NYSE, the indices and the Nasdaq. Below the scrollers are 2 watch lists. . one of the major indices, the other of the volatility indices plus a few wild cards. The Watchlists have an interesting Schwab feature that let's me turn on the real time tick for each item, so I can see at a glance whether the major or vol indices are in alignment.
I've been using this setup for just a few days, but am extremely impressed with it's reliability and ability to discern the market turns. The charts above are shown on 2 minute bars, but the whole display is fractal and can be set to 1, 2, 5, 10, 30, 65 minute or daily bars.
One thing you might notice is the clarity of the VIX chart relative to the SSO chart. The dynamic ATR of the VIX 2 minute bars is surprisingly low relative to the SSO and this is the reason that I juxtapose the 2 setups side by side. While momentum might not be immediately clear on the SSO chart it's crystal clear on the VIX chart.
This is a work in progress and no substitute for a co-located server at the exchanges and a million dollar software program but as a discretionary trading tool it's the best thing I've found to date.

Thursday, July 01, 2010

The Never Ending Story

Yup! . . just like yesterday. TLT actually looks to be accelerating to the upside on increasing volume . . a further grim prognosis for the major markets. And once again we saw a divergence between the GLD and the GDX although the volume in both ETFs has dropped off significantly. FXF has been on fire on also double normal volume and the FXY, which was projected to hit 112 last week, has now reached that target and is looking more than a bit technically overextended.
Almost without exception all the technical gurus are predicting new lows, much lower lows, before a bottoming process can begin. And, based on those nasty HFT driven end of day plunges we have seen over the past 2 weeks, the probability of such a scenario does seem imminent. Those of us watching the markets intraday have noted several clearly bearish patterns, including the negative skew of the TICK spread throughout the day and the preponderance of large plunge bars that may or may not be accompanied by volume surges. This is just more evidence that the nature of trading is changing before our eyes as HFT, algo trading and order management masking create a market environment that is less and less accessible and transparent to the average retail trader. Discount the apologists who claim HFT adds liquidity to the markets . . these are the same folks who believe front running the markets is just smart trading.

Wednesday, June 30, 2010

TLT . . Again

On a day when many of the big caps saw long term support violated TLT was once again the safe haven of choice on Tuesday. After struggling a bit GLD also joined the party, but it's near term prospects look more neutral than positive.
I've adjusted the Rotator components, eliminating NEM and adding GDX, which is the Market Vectors Gold Miners ETF, and which reflects a somewhat wider spectrum of the gold producers than NEM by itself. A quick look at the Gold Rotator shows GLD as the only component that closed positive on Tuesday. This is a rather odd situation reflecting the attractiveness of bullion, but not the underlying companies prospecting and extracting the gold. TLT's chart suggests the potential for more upside on the near term. It is currently chugging along at the mean of the LR30 and not looking overbought. The midpanel technicals are upslope in unison and, while the lower panel technicals are getting a bit toppy, there's scant indication of an imminent reversal.

Tuesday, June 29, 2010

TLT or Not TLT

We did get those new highs in the golds, silver and TLT but only TLT was able to hold those gains at the end of day. A bit surprising to me FXI (IShares China) ended up losing 1/2% Monday . . I was expecting some more enthusiasm for the support of the yuan, but HEY!, you know my bucket list. Also in contrast to my expectations tech didn't exhibit a jump although the retail sector via RTH did display a very modest decline. The glaring exception to retail weakness was WalMart, which rose 2% before that 10 minute closing collapse that shaved 1/4 of the daily gains. Clearly, I need to revisit my crystal ball going forward this week although Monday's closing technicals very uniformly negative.
That was an usually nasty high volume 10 minute sell off reversal at Monday's close...and it was across the board. The 2 minute bar at 12:50 pst was a real doozey on the NYAD...a sure clue that there was more downside to follow.

Monday, June 28, 2010

New Highs Ahead?

Gold and silver look headed for new highs and TLT is tracking in a similar pattern. And there may be good fundamental reasons why. China's decision to let it's currency rise in value adds buying power to it's growing middle class. . . which is both good news and bad news for US companies. While electronics makers can sell more computers and ipods, retailers such as WalMart will find Chinese imports costing more, and since over 85% of WalMart products are made in China, somethings gotta give if they want to hold their price points, which may in part account for Wally's dollar drop on Friday while many of the markets were rallying.
And then there's the weekend's G20 summit with the Pres throwing in the towel . . and that can't be good for the US economy.
This is the equivalent of a one-two punch for the equity markets and looking in the crystal ball I'm expecting some nasty downdrafts this week.
Although we typically see some month end to first day accumulation, that may not be case this month.

Friday, June 25, 2010

Strange Day

FXE really pulled one out of the hat on Thursday, defying the downdraft while at the same time essentially conforming to the intraday cycle of the NYAD. The Rotator now has the FXE ranked in slot #1, a curious situation after Wednesday's action. Rather than waste a lot of time taxing my old feeble brain trying to figure where that rascally FXE is headed next I'll just employ risk management rule #1 and stand back until the technicals sort themselves out. I mentioned earlier in the week that FXE was showing divergence signals on daily and weekly bars and we may be seeing some resolution of that divergence at the present time. Meanwhile, I'm not going to step into traffic until the crosswalk signal flashes all clear.
The yen has touched the May highs again, a scenario that was also suggested earlier in the week and the technicals still look bullish. Ultimate upside FXY targets remain in the 112 range but it's going to take some work to get there.

Thursday, June 24, 2010

Worse Than it Looks

I continue to concentrate on the currency ETFs (and NEM), especially FXE and TLT. The early action in FXE was characterized by another very bearish drop to 1 penny below S3 before it began its intraday run up. In a complete reversal of my previously stated tactic of being short FXE, the early drop allowed me no strategic entry and I therefore took the opposite side of the trade ...long at 121.85. This turned out to be pure dumb luck as the FXE slowly churned up to touch R2 before retreating. That's a huge intraday range for FXE and I was able to exit at 122.85 for a buck gain. Like I said . . dumb luck coupled with the artificial positive beta surge which typifies FOMC days.
Unfortunately, a quick look at the chart suggests that Wednesday's pop did nothing more than push the FXE further into overbought territory . . the technicals are distinctly bearish.
The other object of my attention is my once favorite FXC, which has broken down through the short term LR channel and looks headed for the 93.50 level.
Keep in mind these charts are formatted in 2 day bars. . the daily bar charts look even more bearish.
Both FXE and FXC are exhibiting increasing volume on the distribution side, while UUP volume has fallen off by almost 50%.
The yen continued its run but in the final analysis TLT has the best looking chart of the bunch.

Wednesday, June 23, 2010

No Hiding Place

That nasty afternoon sell off savaged everything but negative beta or very low beta issues. Tech, small caps, energy and financials all caught flak and many of the ETFs suspected in being about to fade, such as IWM, have now turned downslope.
On the positive side of the ledger gold and TLT look encouraging, especially TLT, whose technicals are all poised to continue an upslope run.
On the currency front there's double gold and TLT, accompanied by silver, which has almost reached the 19 target I've spoken about in the past 2 weeks. The yen also is showing some promise, but with only a small likely margin to gain.
FXE . . . that's the real story, and the only encouraging note on Tuesday's action was that FXE stalled slightly below the S1 and didn't plunge to S2 or S3 in the midst of the afternoon slide while TLT manged to gain a buck in the last 3 hours. FXE is actually looking a bit confused with the daily chart clearly bearish and the weekly chart clearly bullish. Go figure.