The 3 Finger Lead (3FL) is a departure from most of my other studies.
First of all, it's a trend following system that seeks to Buy strength in the direction of the trend. No contrarian thinking here, we're just going with the flow and looking to positive momentum in the indices to guide our trades in other ETFs (and stocks).
The study was inspired by an old TS Dow theory study, but I've noodled around with the parameters significantly enough that the original premises are unrecognizable.
The 3FL is also packaged as a "kit of parts" and I plan to play with this thing over the next few weeks in an effort to refine some of those parts and enhance the applicability of the system.
The basic kit component of the system is the "condition" clause and I've offered a couple examples here to kick off the study.
I've arbitrarily chosen EWC (Canada) as the focus ETF and used the big indices DIA, SPY and IWM as the indicators of market momentum. You can test all sorts of stock and ETF combinations and you might be surprised at the versatility of the model.
The system is coded in TS2000i and uses 4 data fields. In TS this is easy to setup, as you simply insert data 2,3 and 4 in the basic chart (Data 1). I have no idea how this is accomplished in various other platform languages, but maybe some of the coding wizzes who visit this blog can help out.

The first thing that jumps out at you on the chart is probably the alignment of the DIA, SPY and IWM. Hard to believe you're looking at three different indices, but there it is. I chose to profile the EWC because it's acted fairly strong in otherwise faltering markets. There are many ways to play this setup. You don't have to use 4 data fields, you can cut it to 3 with a couple quick code edits, and the basic coding can also be used to evaluate possible pairs trades.

Based on our 5 year test period, the system trades an average once/month and delivers fairly impressive results. This version only trades long, although an inverse version will be reviewed in future posts. 52 winners out of 64 trades and only 2 consecutive losers (you know I like that), and with no stops in place the max intraday drawdown is only $310 and the holding time is fixed at 9 days. This is the type of trade to scale in on, although pyramiding has not been turned on.
There are a lot of tactical possibilities tucked away in this system. . .we'll explore a few them in subsequent studies.
I'll just post the code for now, with a line by line explanation to follow next week, if any confusion.
Basically, we're looking for higher closes in the 3 indices, while Data1 is showing a level of strength by holding above a moving average (Len1). Once higher closes in the 3 indices hold for a period of time (Check(10)), a Buy order is triggered.
The Data fields are then reset to zero to avoid false buy triggers.
Finally, the system simply exits on the 9th day of the position.
Inputs: Len1(38), Len2(12), Len3(9), Check(10);
Variables: Dat(0), Dat2(0), Dat3(0), Dat4(0);
Condition1 = Close Data1 > Average(Close Data1, Len1);
Condition2 = BarsSinceEntry = Len3;
If Condition1 AND Dat = 0 Then Dat = 1;
If Dat <> 0 AND Dat <= Check Then Begin
If Close Data2 > Highest(Close Data2, Len2)[1] Then Dat2 = 1;
If Close Data3 > Highest(Close Data3, Len2)[1] Then Dat3 = 1;
If Close Data4 > Highest(Close Data4, Len2)[1] Then Dat4 = 1;
Dat = Dat + 1;
End
Else
Dat = 0;
If Dat <> 0 AND Dat2 + Dat3 + Dat4 = 3
Then Begin
Buy This Bar at Close;
Dat2 = 0;
Dat3 = 0;
Dat4 = 0;
Dat = 0;
End;
If Condition2 Then ExitLong This Bar at Close;
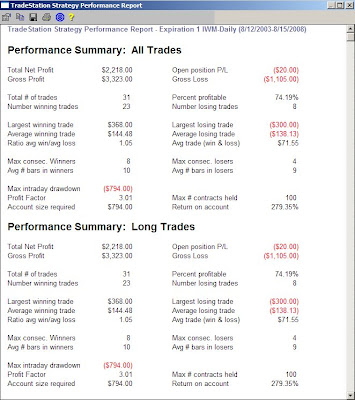
 This REALLY concludes my study of 3 Day Lows. This version is unfinished business from Clueless's earlier incubator of the system. The system still buys the lowest close of 3 days, but then exits on 2 higher closes. As expected this is an active system and kicks out almost 1 trade per week over the 280 week test period.
 Just to tweak things a little bit I added a $65/100 share stop loss. While this increases overall return by over $1000 while reducing avg losing trade $ and max intraday drawdown, it also increases the max consecutive losers to 4, and increases the total number of trades by 50, a substantial number.


