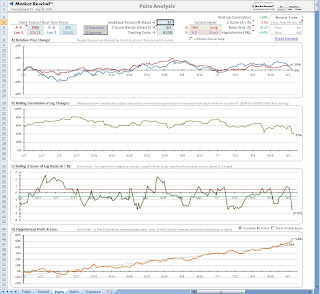
Keeping with my oft voiced analogy of trading and gold mining, you sometimes you find nuggets in unexpected places (and you also find Fool's Gold). Case in point . . today's post.
In my continuing exploration for high correlation Qs pairs I ran the Qs against the major commodity ETFs.
The results, unfortunately, are not encouraging for supplementing my current Qs pairs arsenal.
However, a quick look at the upper matrix will show that the majority of the 90% linearity correlations are linked to a single ETF. . . JJT. Now this looks promising. . . .
If we optimize JJT pairs opportunities in the larger pairs universe there appear to be some very high probability correlated and non-correlated linkages. These various pairs also offer a variety of lookback (N) periods and minimal drawdowns. So far, we're looking good.
But before going any further I've got to warn you that more than a few of these ETFs have pathetic volume, wide spreads and little or no open interest in the options.
OK.....now the REALLY bad news. These JJT pairs are utterly untradeable.
JJT's volume is low to none and the bid/ask spreads will take your breath away.
Forget about the JJT pairs for a moment . . . if you could just sell JJT at the ask and buy at the bid (or anything even close) you'd be very rich very quickly and be able to hang out with the glitterati in Monaco.
Likelihood of such a scenario? Sorry . . . Zip.
The lesson to be learned here is that all pairs have to be carefully deconstructed and evaluated with a variety of metrics to provide the greatest probability of real trading success.
Simply relying on high readings of linearity correlation and P&L is not enough.
On the other hand, there do appear to be a few robust trading pair candidates culled from the commodities matrix that offer some reasonable prospects.
We'll check out one of those tomorrow as the Qs basket devlopment continues.
Wednesday, September 30, 2009
Tuesday, September 29, 2009
Qs Month End Tickler
A new adaptive version of the Month End Tickler for the Qs is currently on a BUY as of today's close with a projected profit target of 6 days. The usual suspects of surprise events can always derail the system, but we have had good results with this model over the past 2 years in both bull and bear markets. FYI
Qs Pairs Basket - Part 1
This will probably be the final series of posts on pairs for a while.
I will still reserve Tuesdays for pairs profiles and unique pairs situations.
Those that have been with me for a while know that the focus of much of my trading is the Qs in various iterations and in that spirit I'll share my exploration for a viable Qs based pairs basket over the next few days.
Just to jump-start the process I'll show a preliminary Qs matrix (above) as a product of various different recent pair scans that I've been examining. In order to maximize the pairs' correlation threshold I've again set the linearity filter to 90%.
However, I've not set a threshold for P&L returns as each pair needs to be evaluated on its on merits for beta, trade frequency and max daily drawdown per the scatter diagrams I've profiled previously with Gold Digger and other pairs.
I've included EXPD (a stock) as a proxy for the transport index IYT ETF. EXPD actually tracks better than IYT and (at least currently) produces twice the net return of the IYT versus the Qs.
Again, this is a preliminary run only and by the end of the week our basket may have a completely different look and feel.
I've shown two of the Qs matrix pairs analyses to reflect the types of variables I want to include in my Qs basket.
#1 . A variety of optimized (N) days lookback periods and hence a variety of trading cycles.
#2 . A low frequency of losing trades.
#3 . Minimal daily drawdown per the scatter diagram
#4 . High linearity correlation
#5 . A consistency of the equity curve above the R2 best fit slope line.
.
As mentioned in last Thursday's post, we realistically have to expect that the basket will be a dynamic entity as high correlation pairs tend to be transitory. The basket components therefore are subject to addition and deletion, depending on their performance relative to the R2 slope and a primary goal of this study is the development of an adaptive algorithm that may be updated daily (or more frequently for possible daytrading opportunities) to deliver an optimized Qs pair trading basket.
Monday, September 28, 2009
Monday VIXology
Friday's close of the VIX and Qs charts shown above.
The Qs did break that RSI2 80 level to the downside on Wednesday, which was our cue to go short as mentioned in last week's VIXology.
The Qs RSI2 is now quickly approaching oversold levels and in the past has shown a tendency to reverse fairly quickly off of the zero level. The 3 bar average (white line) has typically seen the zero line also in prior reversals and my current thinking is to await that cross before getting too frisky to the upside again. The upper LR30 channel band (41) still seems like a reasonable first line of support for the Qs.
Last week was actually the first time my longer term portfolio has been net short since March so I count myself lucky that I haven't succumbed to my mean reversion instincts that have been crying "short" for months now.
Needless to say, I'm ready to reverse course once that RSI2 turns up and the MACD shows signs of strengthening. Job #1 is capital preservation.
The VIX is on a quick roll up, but it too is showing signs of resistance, having kissed the LR30 channel mean on Friday which in turn brought the RSI2 into overbought territory.
As always, we'll just play it one day at a time.
Earnings season is starting again, although there are still 2 weeks until we hit the biggies. My suspicion is that (like RIMM) there may be a few disappointments as most of the belt tightening and cost cutting that resulted in the past 2 quarters of "improvements" have now been implemented and effectively discounted. A spate of such poor reports and guidance could reverse the recent rally dramatically and this is another caution for longer term positions.
Friday, September 25, 2009
NEM Nugget Update
In the course of developing various pair baskets I've made some refinements to the NEM basket components as reflected in the above matrix. I've dropped the SPY and added QQQQ. I've also dropped VTI and added RTH. I've added EWJ outright as a result of my currency pairs study.
Although all the pairs don't comply with my 90% Linearity filter, a closer analysis of the cycles of the lesser performers like SMH, FAS and RTH indicates thay have real value as timing indicator confirmations, so I've included them in the basket although I may not trade them.
Attached are the actual Pairs Analyses for KRE/NEM (above) and EWJ/NEM (below). One of the interesting aspects of these two charts is the proximity of the optimized lookback (N), 30 and 31 days. These are fairly long cycles in comparison with most of those I've profiled in the past but their relative alignment provides a certain comfort level that makes the trade signals quite attractive.
Thursday, September 24, 2009
A Dollar Basket
This is a continuation of the UUP/Qs study with the goal of developing a basket of pairs to trade the UUP. The UUP, of course, is a not a high beta ETF, but when we compare the relative z-scores created by opposing UUP to a few other ETFs, we can actually produce a nice stream of gains with very controlled drawdown (and hence, risk management).
I've set the Linearity filter to (90%) and the quick scan reported here shows some of the UUP pairs candidates and their performance stats.
The Qs, SPY, NEM, DBV and EEM paired against the UPP all present respectable trading opportunities.
A couple caveats:
A couple caveats:
Daily volume in the DBV (double G10) can run less than 100K per day, although it picks up to +300K for occasional spurts, but the spreads are still only .02-.03, so I've included it for this study.
The FXF (Swiss Franc) almost makes the grade but it's volume is typically in the 50K range so liquidity can be a problem. Surprisingly, bid/ask spreads are only .03.
The various 90% basket components do have different lookback periods, which is also helpful in gauging relative momentum of the UUP.
For the sake of space I've only shown 2 of the basket full pairs analysis, but the matrix stats give a good indication of the likely odds of using this approach.
Keith had a comment on Greenfaucet yesterday lamenting the poor performance of the UUP/Qs pair going back to 2 years. I'll reiterate my answer to him: previously I've mentioned the need to look at the position of the equity curve (chart D) relative to the slope of the R2. Strictly as a risk management tool, our tactical approach to trading each pair involves NOT trading when the equity curve falls below the R2 slope. This is one of the reasons for using a pair basket as our goal is to identify differently phased pair cycles, some of whose equity curves may be above the R2, while some may be below. We only want to execute trades in those above the R2 and hold back on the others until such time as their performance improves or, failing that, remove them from the basket and identify other pair candidates whose equity curves are above R2.
This trading selectivty is, in fact, the foundation of the adaptive pair trading strategy we're trying to capture.
Wednesday, September 23, 2009
Qs/UUP - Part 2
This is a postscript to Tuesday's Qs/UUP pairs trade in response to a number of reader e-mails suggesting that simply using Ticker A (Qs) z-score reversals should produce a similar or even enhanced performance to the Qs/UUP pair.
Here's the result of such a test run and I think we can conclude that using the backdrop of the UUP does indeed produce superior returns to simple Ticker A boundary reversals. The other improvements that we see by using a Qs pairs approach is a reduced frequency of trades and a reduced drawdown.
The optimized lookback on the Ticker A approach is 4 days while the pairs approach lookback is 9 days, suggesting that using the pairs approach allows the positions to "breath" a little more, avoiding premature exits (a problem I've lamented previously).
Clearly the net return using a pairs approach is considerably greater than a Ticker A approach and I reiterate my argument that using a basket of ETF pairs to trade a single ETF can minimize risk (my primary concern) and drawdown while generating a consistent revenue stream .
Finally, keep in mind that all of the REWIND pairs charts are based on a 6-month analysis period, so the % gains and linearity correlations shown are for a corresponding 6 time frame only.
Tuesday, September 22, 2009
Qs / UUP Pair
This is a continuation of my study of the REWIND Pairs Trading module.
Today I'm looking at some trading opportunities offered by various currency ETFs and the major indices.
There are other currency ETFs available, but I've tried to narrow the pack to those that actually have tradeable volume, considering that muted volume leads to significant bid/ask spreads that can effectively destroy much of the potential trade gains..
Although there are some interesting inter currency pair possibilities (to be explored at a later time) the object of our current attention is the QQQQ/UUP pair as shown by the red circles and connecting bars. I've set the linearity filter to 90% (as discussed last week) in an attempt to further cull the high probability pairs.
The UUP/SPY and UUP/DBV look like alternate candidates (blue circles and connecting bars) and as I move towards building a UUP based pair basket, their trade cycles and the relative synchronization of of their trigger signals will be explored further.
.
Below is the actual Qs/UUP pair analysis:
While there have only been 7 trades during he last 6 months the Trade Report shows that all have been winners. Now the first thing you're going to say after looking at the Trade Report is, "Gee, Bob, 6 of the 7 trades were long the Qs and short the dollar. . .why not just trade the Qs?"
That's a very good question (I often have these conversations with myself) and my answer is that it's easy to see things in hindsight, but a bit more problematic in real time. Those that have been predicting a significant mean reversion pullback for the past 2 months haven't fared very well but this little pairs model would have kept you on the right side of the Qs (and the Spy as it turns out). Sometimes the best use of a trading system is not as a strategy per se, but as a timing model, and in the case of the Qs/UUP I think the evidence speaks for itself.
Monday, September 21, 2009
Monday VIXology
The current VIX/Qs charts look eerily like last week's with a slight improvement to the Qs overbought conditions and the VIX's oversold condition.
The VIX's mid-panel technical have returned to the zero line and Moneystream has actually turned upslope. The RSI2 has also turned upslope showing the greatest promise this month for a possible run back to the lower LR30 channel band @ 26.
The Q's mid panel technicals on the other hand are showing some slow down and Moneystream is hinting at becoming downslope.
In contrast, the Q's RSI2 is not showing any weakness at the current time leading us to be cautious about a bearish stance at this time.
From a risk management perspective, the odds favor continued bullish action. Should the Q's RSI2 finally roll over and penetrate 80 accompanied by a MACD zero line cross, the odds would then favor a bearish position.
Taking off my quant beanie for a minute I also note that the DOW is currently at 9820 and the SPX at 1068. In the past we have seen run-ups stall at milestone numbers . . in this case DOW 10,000 and SPX 1100, further suggesting that we'll see these numbers prior to any significant reversal.
Maybe Rob Hanna will chime in with some numbers here to confirm or deny.
.
Tuesday I'll get back to pairs trading and show how some nice low risk gains can be captured by playing the currency ETFs.
Friday, September 18, 2009
Gold Digger - Part 4
This post will conclude the Gold Digger series for now. I'm in the process of developing a few additional metrics and a graphical interface and may post in a week or so when finalized.
For now, I've added GLD to the matrix to demonstrate my argument for using NEM in lieu of GLD to trade gold.
In this case the hypothetical P&L for GLD versus the other components of the matrix is tracked vertically and the Linearity of correlation is tracked horizontally. That's in contrast to the way NEM is tracked and reflects the nature of the matrix.
One other feature of the matrix is the ability to build a basket portfolio by manually adjusting the filter threshold for Linearity. In this case I've entered 90% (red circle) which, in turn, highlights those returned values 90% or greater, and which can be added to the Optimized Portfolio list, saved and updated on a daily basis. This function lets us view the updated day-to-day performance of the so called "optimized" portfolio and allows us to cull under-performers and/or add new star performers.
.
Regarding yesterday's look at the Trade Reports for the XLE, DIG, ERX and NEM pairs I've shown the scatter diagrams of daily P&L for the XLE and ERX pairs to emphasize what you're buying when using ERX in lieu of XLE. Basically, you're buying risk.
The daily P&L tracker is not a resident report in the Trade Report, but Jeff has graciously given me limited access to the program source code so I can noodle around with it and produce little vignettes like these.
Note that the volatility surges mirror one another between the two reports. . for example 3/1, 6/1 and 9/1, but what's different is the total range of gain and drawdown. . . +10 to -10% for the XLE pair versus +20 to -20% for the ERX pair.
While there is some lag in signal timing of the XLE versus ERX pairs (as shown in yesterday's Trade Reports) the choice of a preferred pair ultimately revolves around the level of risk exposure you're willing to tolerate.
From that perspective, running a quick thumbnail matrix of various pair Betas, Linearities and P&Ls can deliver a comparative view of pair probabilities and anticpated risk exposure.
Running a Linearity filter can provide a performance baseline for evaluating the relative merits of each matrix pair.
And, maintaining a portfolio of filtered pairs while standing back from trades whose P&L falls below the R2 slope line can provide a nice revenue stream with controlled drawdown.
.
My intent for the next month or so is to profile one pair (and pair matrix) per week as part of an on-going refinement of my own pairs trading strategy. That post will be on Tuesday as Monday's are reserved for VIXology updates until further notice.
.
One final comment in response to a number of emails suggesting my past 2 weeks of REWIND related posts are just a big advertisement. They're not . . and I receive no $ from Jeff for profiling his Pairs Trader. I won't be vacationing at his chateau on the Cote d' Azur, cruising on his 125' super yacht, or partying with him at Cannes with Brad and Angelina.
I just think the program's a true winner, especially as a risk management tool and my intent over the past 2 weeks has been only to share my exploration and enthusiasm for the product.
Nuff said...............
Thursday, September 17, 2009
Gold Digger - Part 3
This is part 3 of the Gold Digger pair setup started on Tuesday. I've expanded (and corrected, Thanks Ty) a sample matrix that can be useful in identifying probabilities for various NEM based pairs.
Tuesday's matrix only profiled DIG as an energy pair mate, so for today I've added XLE and ERX to illustrate a wider range of results possible by using the ultra and triple energy ETFs.
Remember from yesterday that the optimized lookback for NEM/XLE was 24 and 15 for NEM/DIG.
The NEM/ERX pair returns a lookback of 14, most likely a product of the higher volatility of ERX.
Yesterday I also mentioned the relative clarity of the z-score reversals and, of the 3 energy ETFs, ERX produces superior signals.
.
Below are the trade reports for the 3 pairs models: NEM/XLE
Wednesday, September 16, 2009
Gold Digger - Part 2
Continuing with our Gold Digger review, here are the trade profiles of the XLE/NEM and DIG/NEM pairs looking back 6 months.
I'm showing the dichotomy between XLE and DIG relative to NEM in order to illustrate the variable performance of a correlated pair based on the leverage offered by Ultra ETFs like DIG.
Note that the optimized lookback period (N) for XLE is 24, while the corresponding (N) for DIG is 15. The implication is that the NEM/DIG pair will trade with a higher frequency and, other things being equal, produce a higher net return.
Before we decide that the NEM/DIG pair is the better option, we need to look at the daily drawdown and max possible lost over our test period.
Keep in mind that we also need to keep an eye on how the hypothetical P&L (equity curve) is riding along the R2 slope. Once the equity curve falls below R2 the safest course of action is to not trade the pair until the equity curve resumes precedence to R2.
This risk management approach is the key argument for using a basket of pairs as profiled yesterday as the performance of the equity curve relative to R2 will most often be out of sync among components of the pairs basket.
Having looked at a few hundred of these pairs over the past 2 weeks, one attractive characteristic of the NEM/XLE and NEM/DIG pairs is the clarify of the Z-score reversals as shown on chart C. In most cases the turns are signal events with little slippage or redundancy.
The DIG pairs does produce a shadow trade on 5/4, but this should be considered an opportunity to re-enter or scale further into the 4/18 signal.
Tomorrow we'll look at what risk control advantages the embedded Trade Report (lower right below chart D) can provide.
Tuesday, September 15, 2009
Gold Digger Pair
This is the first installment of a 3 part series on a pair trade I've called Gold Digger. It will, of course, feature the Market Rewind pairs analysis and optimization toolbox that I've profiled for the past 2 weeks and chronicle the evolution of the Gold Digger system.
There's been a lot interest in gold recently, mostly because of it's significant run up I suspect and a few readers have e-mailed me asking for a gold system in the spirit of my previous Dirty Dozen posts. This is a tangential response to those requests.
As I've mentioned before I don't like the way the gold ETF GLD tracks technically, much preferring NEM, which offers the added advantage of penny spreads on the options (GLD is nickels and dimes). While GLD typically trades almost twice the volume as NEM, it's my experience that NEM still tracks the pivots and my other indicators better than GLD, but that's just my view.
For today's post we'll focus on my oft-stated goal of developing a basket of systems to trade a small basket of ETFs. In this case we'll look at using a basket of pairs to trade a single stock -NEM, per the argument above.
The Rewind Matrix allows you to quickly create such a basket approach by simply loading our target NEM and any variety of potentially correlated or non-correlated stocks and ETFs. For our initial scan I've picked 8 of the usual suspects and run out the Matrix for both linearity and profits based strictly on Condition #2 (Z-score reversals) . . the most basic optimization option.
Looking at NEM in the #1 matrix slot and running down the matrix column we see the resultant linearity correlation of each of the 8 comparison ETFs.
Looking at NEM in the #1 matrix slot and running across the top row we see the resultant hypothetical P&L for each of the 8 comparison ETFs.
You can also check out the relative correlation & P&L performance of any of the other resultant pairs by simply clicking any cell on the live matrix.
A few of these pairs (such as UUP/KRE and UUP/SMH) look worthy of further exploration and we'll actually follow the money on this idea in depth next week.
The matrix is just an initial screening tool to help identify potentially high probability pairs. Tomorrow's look at the individual pair optimizer and it's toolbox should help us get a clearer picture of the actual risk exposure inherent in each pair.
Monday, September 14, 2009
Monday VIXology
The weekly update of the VIX/Qs charts shows some interesting developments.
A casual glance at the VIX chart might prompt a negative forecast for the Qs. The VIX is riding below the LR30 lower channel band, looking well oversold and a mean reversion outlook would bring the VIX back up to 26 as a first target.
Correspondingly, the Qs appear topping and/or moderately overbought based on the midpanel technicals and the RSI2 suggesting a short term retracement to a 40 level.
.
There is an alternate scenario however that must be given serious consideration.
The white vertical line at the July 15th marker defines what looks like a chart pattern very similar to what we're seeing today.
There are exceptions . . and these are significant.
I have mentioned a phenomenon known as "kissing the channel good-bye" when price breaks
either up or down away from the LR30 channel band and a new paradigm is formed.
The current VIX chart alignment strongly suggests the likelihood of such a kiss-off.
First of all, Moneysteam MS (a proprietary Worden Bros indicator), remains solidly downtrend in the VIX and uptrend in the Qs.
Second, the behavior of the Qs RSI2 following the July 15th apparent top reinforces our previously tested systems that argue for not trading RSI2 tops but rather RSI2 crosses down through overbought levels. . and we're not there yet.
Third, for several months we've been watching the VIX in a slow descent on the VIX Pivot Bands with an eventual target of 20, and then a leveling off. That 20 milestone has yet to be hit, but the recent behavior of the VIX over the past week continues to argue for that target.
On balance, the odds continue to favor the bulls.
Last week I was looking for the Qs to hit 41.25. We made that plus a quarter.
.
Going forward this week I'll profile in depth a NEM based pairs trade that I call Gold Digger. It's a very high probability pair with no losing trades and an equity curve that continues to rise today even though most of the other pairs that I've profiled recently have crossed through the R2 slope over a month ago.
Finally, thanks for all the pairs comments, feedback and e-mails . . they've kept my little pairs project on course and caused me to rethink some of my evaluation parameters and pair setups. The real brains behind this whole pairs modelling is, of course, Jeff Pietsch, over at Market Rewind and he has graciously and quickly reacted to any and all of my nagging suggestions and technical issues with the pairs algorithms.
Think of Jeff as the engineer and fireman for the pairs train.
I'm just a conductor riding in the caboose.
Friday, September 11, 2009
GE/XLF GE/FAS Pairs
Today's pairs study is a little departure as it reviews how GE (a stock) trades against XLF versus its steroids driven version FAS.
Those who have followed me for a while know I actively trade GE, one of the very few stocks that I include in my portfolio.
I like GE as a trading vehicle for several reasons.
...It's a close proxy for overall market momentum and sentiment built into one product.
...It's a financial and a tech stock, although more responsive to the financials than tech.
...It's got tremendous daily volume, often exceeding the Qs.
...The NYAD tracks GE like radar and I've posted several studies under the HOW I TRADE right blog panel.
...GE reacts positively to VIX crosses on 1 & 2 minute bars as shown on the VIXEN studies.
.
Just to establish a pairs correlation between GE and the financials I ran XLF as a acid test, with a resultant correlation and P&L both in the mid 80s . . a good risk/reward IMHO. The optimized trade cycle period is 17 days, a little long for my comfort level, but that's just me.
When applied to shorter time frames such as 10-60 minute bars, the trading landscape changes considerably to the favorable.
Fast forward to the GE/FAS pair. These prospects really look encouraging as we now have 100% correlation and a handsome 262% P&L. Perhaps as expected, the trade volatility (frequency) has been compressed to 2 days. I like that.
As with the GE/XLF model additional testing of shorter term time frames is required to validate this pair as a viable daytrading application. The possibilities are . . interesting, to say the least.
Thursday, September 10, 2009
DBA and XLE DIG Pairs
Here's a look at the DBA/XLE and DBA/DIG pairs. We're looking at the variation in various trading metrics when using a single x ETF (XLE) versus a 2x ETF (DIG) against the DBA agriculture ETF, which reflects a basket of sugar, soybean,corn and wheat futures.
Two arguments favor using the DBA/DIG pair from my perspective.
#1 . . the lookback period or cycle for the DIG pair is 9 days. . .the XLE pair is 27 days. That involves considerably more total exposure for the XLE pair (time in the market) and fewer cycles (trades), which in turn impact. .
#2 . . the hypothetical P&L. For the XLE pair this is 54%, while the DIG pair yields 84%.
.
Between these two scenarios the more volatile of the energy ETFs appears to deliver the better trading model. XLE is currently trading about 17M shares a day, while DIG, which was averaging around 11M shares a day in July has now dropped to 3.5M a day.
Both DBA and DIG option open interest and daily volume are very thin and the option bid/ask spreads are often .25 to .40, further making them unattractive for pairs option spreads. Cash only please for these pairs.
Wednesday, September 09, 2009
SHY, TLT & FAS Pairs
Here are 2 ideas involving essentially the same concept. . . trading treasury bonds against the financials triple ETF.
TLT is the I-Shares 20 year treasuries ETF and SHY is the I-Shares 1-3 year treasuries ETF.
TLT trades about 3.5M shares a day, SHY about 800K. Both have options although the open interest and daily volume in SHY options (often zero) precludes using them in any realistic spread strategy.
SHY does produce an overall better net return over our lookback period and both optimize on a 5 day cycle (see Lookback period (N-Days) but IMHO TLT is probably the lower risk situation.
FAS trades around 30M shares a day (and a bit volatile) and the option open interest and daily volume is robust across a 10 point strike spread and more. Keep in mind FAS is a triple and as a result the bid/ask spread on most of the options is not pennies but typically quarters, so that risk has be to considered when playing a pairs option spread on the underlying.
Tuesday, September 08, 2009
Tuesday Vixology
This is an update of the VIX/Qs charts displaying the current relative position of the daily price bars on the linear regression 30 channel.
Signals are bullish on both charts, the Qs having actually reached an extended oversold condition.
The 3 day reversal of the VIX following the 9/1 pop looks eerily similar to the 3 day reversal following 8/17 and the short term technical expectation is for a continued consolidation of the VIX around the 25 level.
The VIX has ridden the rails of the LR30 channel for 2 months now, a relatively long historical period to trade within a 4 point range with only 2 significant breakouts to the upside.
At this point the safe course of action is to await the break, either up or down and then follow suit.
VIX momentum is currently downtrend and using the VIX channel to attempt forecasting market momentum for more than a few days has proven to be a fool's game in the past but IMHO a break of 41.25 in the Qs would be supportive of a renewed bull rush.
Saturday, September 05, 2009
DIG FAS - Part 2
Hare are two further observations regarding Friday's DIG FAS pair trade.
Above . . after whining to Jeff that I felt the trade distribution was a vital metric, he provided me with a beta version of REWIND +, an enhanced platform designed specifically for pairs trading.
As expressed on Friday, my concern was the max daily drawdown because I hate drawdowns and gauge the value of a trading system more on the ability to minimize drawdown than the ability to maximize gains. . . that's just me.
The chart is run out (or back) 153 trading days and displays the incremental % gain or loss for each day. These are not trades, just a reflection of how the equity curve is developing on a day to day basis. Out of 150 days the pair produces 5 outlier losers in the -10 to -15% category and 2 outlier losers in the -15 to -20% category. IMHO these are respectable results for a 153 day time frame.
To get a further sense of what's going on with this pair's equity curve I've expanded the P&L chart from the original post and high lighted in red and green the crossovers of the R2 (squared) line and the P&L line.
The best P&L gains are clearly made when the P&L line rides above the R2 while marginal or negative returns are realized when the P&L rides below the R2.
Keep in mind that one of my ongoing goals is smoothing the equity curve through systematic risk management. What this metric suggests is that the pairs model can be improved with a rather simple timing model . . . and, if we examine a larger universe of pairs as part of a pairs portfolio, capital can be culled out of sub par ETFs and rotated into pairs that are "performing" above the R2 line (or other trending metric).
As a followup to yesterday's archived post, I'm adding this archive to help traders who might be otherwise inclined, to reign in those hormones.
Friday, September 04, 2009
DIG FAS - A Big Pair
In a continuation of yesterday's introduction of the REWIND pairs trader. . . here's a turbo version of the XLE XLF pair trade using the 3x bull energy versus the 3x financials. This trade is what I call buying risk and one metric that has yet to be clearly defined is the max daily drawdown such a pairing might incur. We're working on it at the REWIND development center.
Clearly the results are stunning and with a rolling correlation of 100% the profit potential is there for those willing to stick their neck out a bit.
For backtesting I've turned on condition #2, which looks for active z-score reversals and I've optimized for both P&L linearity and profits, although with this testing environment you can choose Linearity of P&L or Cumulative Profits or Linearity x Cum Profits.
Note in the Neutral Trade window that you have to trade 2.5 shares of DIG for every share of FAS to create a balanced capitalization.
For those attempting this trade I would first recommend reviewing an archived post that argued for certain visual aids to help you keep up your enthusiasm in high stress environments.
.
Keep in mind that these results are reflective of daily bar activity. Those of you who have been with me for a while know my real interest is more on daytrading and the next iteration of this pairs study would have to focus on a 5 minute bar version. I'll keep you posted.
Thursday, September 03, 2009
Get a Pair
Over the next few weeks I'll be rolling out some ideas and tools for pair trading. Rather than reinvent the wheel I'll rely on what I believe are some of the most robust and effective pair trading metrics available to the average retail trader and they all reside at Market Rewind.
The actual Rewind matrix is a fee based product, but incredibly modest in price. Jeff's major focus is the ETF universe, but the pairs tester and optimizer can handle stocks as well and in the spirit of my 3 finger lead systems, I'll show in subsequent posts how using select high beta components of various ETFs in conjunction with the underlying ETF as a pairs trade can produce rather stunning results.
For today's example, I just ran a comparison of DBA against NEM. Now I could have used GLD as the gold proxy, but frankly, as I've mentioned before, some financial products just don't track that well technically and from that perspective NEM is much superior to GLD (just my experience).
The Rewind Pairs Analysis tab has a number of great features that let you get a good sense about a trade's potential in a very short time.
First of all, you've got real-time pricing, so hypothetically you could update the file every 60 minutes (or sooner) to catch any changes in the operative signals, which are clearly defined as Long, Short or Out.
Once the pair is set up and date downloaded (instantaneous) a simple tap of the Optimize button will calculate the rolling z-score, beta and hypothetical P&L. Depending on where you decide to execute the trades (at the band crossover, at the cross back at the zero line) you incur more or less risk exposure and more or less net return.
The matrix tab lets you test a variety of combinations at once while the Rewind page itself allows the creation and application of multiple scanning filters to limit the pair parameters.
Jeff's got a number of videos that explain the Rewind processes . . all provide an excellent guide into what this Mother Lode of a program can deliver. Updates and refinements are on-going and the program promises to be valuable component of my trading, so check it out.
Wednesday, September 02, 2009
Qs VIX Advantage
This is a Qs application of the VIX % Advantage system that I posted back in August.
Let me just say at the outset that my intent on exploring this variation is for use as a timing indicator, not a trading vehicle. The original SPY based study and the subsequent Topticker post focused on whether use of a simple reversal system like the Double 3s made use of the VIX change study irrelevant.
Those who have followed me for a while know that I like non-correlated system confirmation of my trading signals, both daytrading and swing trading, and the VIX Ad applied to the Qs provides a 10-12% confirmation edge that can't otherwise be attained by using the Double 3s (for example) by itself.
Since the goal of the system is not as a trading system per se I've turned off the MarketPosition=0 condition to create a timing model that more closely resembles a stop and reverse system.
Optimized inputs for the Qs are 3,2,4.
Worth adding to your Qs trading arsenal IMHO.
Tuesday, September 01, 2009
Qs Month End Tickler
And now, . . .for something completely different. Many traders have a suspicion that just buying the last day of the month and holding for x number of days could be a successful short term trading strategy.
There have been a number of approaches to test to theory and here's one applied to the Qs using a simple moving average entry filter.
The first comment to come back to me will probably suggest using the exponential MA in lieu of the simple, and at first glance that seems like a logical odds enhancer. Unfortunately, that's not the case. The SMA provides considerably better results than the XMA.
Personally, I like the odds here. Max intraday drawdown is quite low on a 100 share position and the MAX consecutive losers, both long and short, is only 1!.
I've only backtesting for 28 months and within that time frame the system has generated 18 signals. There are a number of alternative entry filters that might be considered and I'll leave that to my ever-inquisitive readers. Ditto on the exits. It may make sense to apply a little trailing stop, but this simple system has some clear possibilities for short term exposure with good odds for a respectable payoff.
TS2000i code is shown below with the optimized inputs for the Qs. If you're considering using this in conjunction with other ETFs, indices, etc. I highly recommend re-optimizing for those positions as the underlying beta will likely effect the MA settings.
Subscribe to:
Posts (Atom)