
Once again yesterday the Qs demonstrated their momentum edge. closing in the green while SPY and IWM turned red. And once again, not a lot of technical disparity between the top4 slots, which really is indicative of the ongoing broad advance of the markets. That, and a VIX below 17.
I've juggled the metrics columns format once more and I think this is a keeper for a while. The yellow column is still the daily % change, while the column to the right "Price" is, in fact, a Worden Brothers algorithm that calculates a proprietary price volatility value. It's like beta, but it's not. The next column to the right "5 Day' is the 5 day performance of the ETF relative to the performance of the SPY. Beta is , of course, beta. I don't know why Worden can't figure out the VXX beta. . it's currently at -2.16 according to other data vendors.
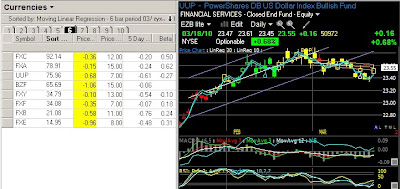
The Rotator models above and below reflect an ongoing research project that has so far shown considerable promise. I'm using the same 6 period 2 day moving linear regression channel slope to sort the Rotator components and define ranking. FXC and EWC have been the top $ and country for a while now and if you take a peek at the charts (not shown) you'll quickly see that Canada has been on a tear. While the Canadian dollar continues to shine, Mexico has now taken over as the top momentum country. . not exactly sure why. . pre Cinco de Mayo exuberance maybe? These are fairly low risk models as the currencies and the countries tend to trend for extended periods of time and typically flash broad technical signals of impending reversals.


No comments:
Post a Comment