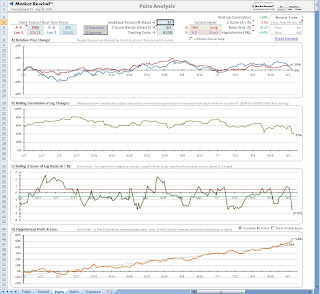
Here's a look at the DBA/XLE and DBA/DIG pairs. We're looking at the variation in various trading metrics when using a single x ETF (XLE) versus a 2x ETF (DIG) against the DBA agriculture ETF, which reflects a basket of sugar, soybean,corn and wheat futures.
Two arguments favor using the DBA/DIG pair from my perspective.
#1 . . the lookback period or cycle for the DIG pair is 9 days. . .the XLE pair is 27 days. That involves considerably more total exposure for the XLE pair (time in the market) and fewer cycles (trades), which in turn impact. .
#2 . . the hypothetical P&L. For the XLE pair this is 54%, while the DIG pair yields 84%.
.
Between these two scenarios the more volatile of the energy ETFs appears to deliver the better trading model. XLE is currently trading about 17M shares a day, while DIG, which was averaging around 11M shares a day in July has now dropped to 3.5M a day.
Both DBA and DIG option open interest and daily volume are very thin and the option bid/ask spreads are often .25 to .40, further making them unattractive for pairs option spreads. Cash only please for these pairs.


6 comments:
When looking at this pair are you trading it dollar neutral or considering the beta? How are you making that decision?
Great Blog
Alberto,
The "Neutral Trade" window on the upper right of the worksheet defines the ratio of A/B share size to accomplish a neutral trade. Is this your question?
That is basically my question. I am complicating things a little bit. Consider a pair involving an inverse ETF (XLF/FAZ) which logically would require you to be long/long or short/short and where the inverse ETF is leveraged so you would theoretically need a smaller dollar amount of shares to hedge your XLF position properly. I ran this pair through the spreadsheet with 3 day lookback and 0.9 z-score and then looked at the trade report and can't seem to make sense of the results.
Alberto,
I'll ponder that for a while. Interesting that the XLF/FAZ P&L curve is a lot smoother than the XLF/FAS curve. I believe the REWIND algorithm is aligned to trade A versus B, not in tandem, so that may be part of the problem. Since you already have the program you can also contact Jeff directly for further clarification.
I agree. I will check with Jeff as this could impact the results of any leveraged ETF trade. I believe that is where the "beta" comes in. In the case of XLF/FAZ the beta is (550)so if you sold 550 XLF versus short 100 FAZ that about works out. I just don't know that the P&L is being calculated properly in that case. Will let you know what Jeff says if you are interested.
Interesting pair. The model uses a dollar neutral method at this time. Therefore, minimally be careful you are not over weighting beta by mixing and matching leverage. Also, if you are trading levered and unlevered versions of the same underlying, you may actually be trading a modified Bollinger strategy, which may also be independently tested in the ETFR. Thanks for all of your good work BZB!
Post a Comment