Tuesday, January 26, 2010
Project Z Update
As with many of my previous projects, things tend to take longer than originally expected and various programming glitches along the way have caused me to fall substantially behind schedule. Those who have dabbled in the world of quantitative analytics appreciate the time that minor problem resolution may require and I've had to postpone my typical afternoon naps to try and catch up. Bottom line. . Project Z is not likely to see completion until at least mid February.
In addition, I'm going off grid for a bit testing day trading opportunities with the Project Z indicator on 30 and 60 minute bars. These aren't typical daytrading bar increments but, following my previously voiced arguments for keeping your equity curve growing . . . trade what works.
In case you missed it, Monday was Bubble Wrap Appreciation Day.
Tuesday, April 13, 2010
The Qs Situation

The performance report for the Qs and Project Z are shown below for my typical 16 month floating analysis lookback window. The Long side trades have clearly done very well, but I'd be lying if I didn't admit disappointment with the lagging performance of the Short side trades. Of course the markets have been in a steady up swing for the past year and trading the short side has been more than a little problematic for most traders, but a lesson to be learned here is the old adage, "don't trade against the trend", or if you must, then have a tight stop in place and follow the trading plan.
Wednesday, March 03, 2010
MLR Rotator Mods
The MLR Rotator now has a slightly different look and an adjusted portfolio of components. I've initiated the component changes based on continuing Project Z studies and will eventually merge the output of single stock/ETF Project Z system studies with the MLR ranking in order to evaluate the rotation model using 2 diametrically different timing models.
First, the deletions . . DBA, EFA and DIA. DBA has never fared well as a rotator candidate and DBC effectively covers the commodities market for my study. EFA tracks technically very similar to EEM and I prefer the robustness of EEM. DIA is, in my opinion the toughest of the majors to trade technically. The massive gaming by major prop shops of DIA components makes trading this ETF a challenging proposition and I think there are many other ETFs/stocks that respond to timing models in a more reliable manner. Project Z actually does a great job of timing the DIA (85%+) but I think it's 30 stock base makes it too susceptible to surprises. That's just me.
New components include GE, BAC and EWC. While those selections may seem a bit odd at first glance there's really some method to my madness. GE is like Caesar's wife, all things to all men.
It's a financial stock, it's a tech stock, and it tracks more like an ETF than a single stock. With daily volume that often exceeds the Qs and IWM, GE is a high beta juggernaut that provides some attractive trading opportunites for short-timers like myself. Ditto for BAC which routinely trades 200M shares a day and which tracks very well technically. While it has no tech side like GE, BAC does have a beta 1 point higher than the XLF and for rotation evaluation purposes I believe it will prove useful to see how BAC ranks relative to XLF on the daily rotator update.
EWC . . OK, here's a wild card but, after many, many hours of testing, I've found EWC provides an interesting relational sounding board for both EEM and GLD, and EWC technically tracks very well (92%) on Project Z.
Side note: I've realigned the Rotator columns with % change (yellow) moved closest to the sort value. To further clarify: the "5 Day" column is looking at the stock/ETF's 5 day performance relative to the 5 day SPX.
Wednesday, June 02, 2010
Project Z Loves TLT


Thursday, February 04, 2010
Project Z and the Qs
This is the Project Z outlook for the Qs as of Wednesday's close. Based on the Project Z parameters the Qs are quickly approaching overbought conditions relative to overall market volatility. We have multiple exit conditions and trailing stops in place to limit risk exposure and retain any gains and I expect the current open position to be liquidated today or Friday. The current trade had a double entry (second entry at yellow dot) and is at a break even point after a 5 day duration on the initial entry while holding a .63 gain on the second entry .
Below, the daily rotation model using a 6 period moving linear regression has now pumped the Qs into slot #1. I've exposed a previously hidden metrics column (in yellow) which shows the % change in price for the day. This is the metric that I use as opposed to absolute price, which really provides no basis for evaluating relative performance. While the Qs lagged yesterday, they made up the difference (and more) today.
Wednesday, May 12, 2010
GLD Bug

The Project Z GLD signal is currently flat having booked some nice gains (shown below).

Wednesday, January 13, 2010
Project Z
First, over the next few days we'll look at each of the 4 ETFs . . EEM, DBC, QQQQ and SH through the lens of the VXX , the ETN derivative of the VIX that trades like a stock.
Utilizing the ETF Rewind pairs analysis should help provide a perspective on the relative volatility and technical linearity of each ETF while at the same time detecting the highest probability entries, exits and, perhaps most importantly, holding times.
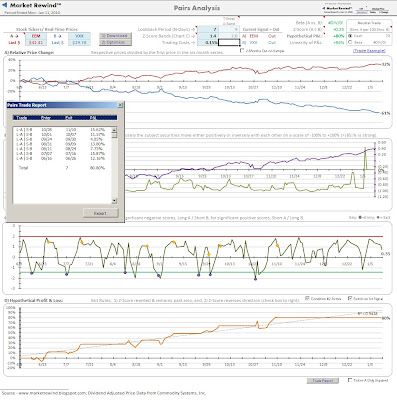
Today's view is of the EEM and, as with all the current ETF Rewind pair studies, displays pair performance for the past 6 months only. Jeff's made several refinements to the earlier version of the algorithm and its now possible to set separate values for the high and low values of the z score bands and thanks to my constant whining he's added an N day stop that prevents unsuccessful band reversal excursions from progressing very far past the optimized N day value.
In this case that stop is set to 9 days, providing a little breathing room for the reversal but not allowing it to run wild. These 2 little mods improve performance significantly and eliminate all marginal and over extended losing trades.
Over the 6 month test period the system kicked out 7 trades with an average hold time of 7+ days, leaving us with cash about 70% of the time that can be deployed into other momentum candidates.
Note that all the trades are Long A (EEM) and Short B (VXX) and effectively detect positive surges in EEM momentum, which is really what we want to exploit.
Next up . . . my leeettle friend, the Qs.
Wednesday, July 14, 2010
Mid Week VIXology

OK .. a little aside here. I keep mentioning the use of 65 minute bars in lieu of 60 minutes (hour) bars because there are 390 minutes in the trading day and 60 doesn't go into 390 very well, while 65 (or 130) fits very nicely. Now, in the process of bringing Project Z to the market in the forthcoming ETF Prophet site, one of my loyal trading buddies tested the SSO/TLT model using both 60 and 65 minute bars. The results are pretty amazing, with the 60 minute model showing a flat equity curve, while the 65 minute version was a true thing of beauty with a continuously upslope equity curve. Now that analysis applied only to the modified z score algorithm that drives Project Z, but let me just suggest that system traders working on hourly bar signals may do themselves a favor and try 65 minute bars for a performance comparison.

Friday, June 04, 2010
Currency Report


Friday, January 15, 2010
Project Z - DBC
This is post #3 of Project Z.
Today we're taking a look at the relative linearity and performance of the DBC/VXX pair as a component of our rotation model.
The DBC is the PowerShares double commodity index and has a current beta of only .66 . . considerably less than the previous rotation model components we've examined.
I could have used the UYM (beta 2.92) the PowerShares ultra basic materials or the XLB (beta 1.25) Spyder sector basic materials to reflect the materials/commodities component of the rotation model, but for illustration purposes we'll just track the DBC.
The XLB has the most robust option chain of the 3, the UYM has the thinnest.
Just as an aside, the UYM works almost as well as the DBC in the Lazy Man model.
One of the consequences of the DBC's low beta is a resultant higher N day value (15) than we've seen before. I've allowed the bands to run 2 more days before initiating the fixed bar stop.
There's still a little problem with the fixed stop algorithm timing as shown by the red highlights and Jeff is currently addressing that issue. We actually had a double entry on the last trade confusing the stop algorithm into thinking there was still time to run. That will be corrected and the trade entered on 12-16 would actually end on 1-6 with a resultant %2 loss in lieu of the -19.66% shown. Another difference between the DBC and the previous ETFs is the balance of long and short trades . . in this case 4 shorts and 5 longs.
Tuesday, May 11, 2010
Gold Currency

At the same time I've created a separate MLR gold rotator featuring the GLD ETF and 11 highest market cap gold stocks. ABX, AU GG, KGC and NEM are the largest market cap gold stocks with ABX at almost 2x NEM's cap.
The GLD ETF understandably has the lowest beta, barely 1/6 to 1/9 of the stocks. This differential is further reflected in the price volatility metric column where GLD ranks lowest. I've got a little EXCEL spreadsheet that normalizes the price volatility/beta and the % change (yellow column values). Hopefully, I'll be able to integrate those results into Telchart or, failing that, simply export the data to an EXCEL charting format.
The odd outcome of Monday was that GLD declined while the majority of the gold stocks rose (GOLD was the exception).
On the Gold Rotator ABX is the leader with GG and EGO close behind.
On the Currency Rotator GLD is in the top slot despite Monday's weakness, reflecting the big gains over the past five days.

Thursday, January 28, 2010
The Situation
So, while scrolling through the components of my Telechart rotation model, I was struck by the current "situation" in XLF and EEM and decided to explore a little further.
As of Wednesday's close both XLF and EEM fired BUY signals through Project Z . . XLF with an 82% probability, EEM with an 88% probability.
Both ETFs share a similar beta (1.47 & 1.60) and both are dead on the bottom of the rotational model (ROT) components with values of -32 and -35. This low weighting in the ROT in no way reflects the potential turnaround possibilities for these 2 ETFs . . it just indicates that positive momentum as measured by the 6 period moving linear regression on 3 day bars has not yet become apparent.
If I rely on the Project Z defined momentum cycles for my entry, then I know my target exit is 8 to 12 days away, if not sooner. Tomorrow I'll take a closer look at the possibilities for a low risk spin off trade based on the "situation".
Tuesday, March 09, 2010
VXX Tracking the VIX
This brings up caveat #2. The performance results of this study should only be considered in reference to the number of successful/winning trades. Since the VIX is a statistic and not a tradeable entity, there's a few monkey wrenches that have to sorted out here. The dynamics and pitfalls of entering these signals as VIX options trades are well beyond the scope of this post and each trader has to assess his/her risk exposure comfort level which, in turn, will determine how these signals are translated into trades.
Side note: the yellow dots along the price chart are pivot high/pivot low signals generated by the TS default PH/PL algorithm set to 4/2. I use the signals as a second set of eyes to confirm entries and guard exits.
I view this current study essentially as a jumping off point for further research but it's encouraging to find this initial foray into VIX/VXX alignment so consistent.
Sunday, May 09, 2010
Moving On

Thursday, January 14, 2010
Project Z - Qs
Today we look at the QQQQ component of our Lazy Man trading model using the VXX lens.
Once again we're looking at a divergent pair and in response to a comment by Gary on yesterday's post, keep in mind that I'm really not interested in taking both sides of this trade . . I'm just using the VXX to gauge the relative volatility and linearity of the rotation model components.
Just as a point of reference the current beta of the Qs is 1.1o, while the beta of the EEM tested yesterday is 1.47.
It is therefore a little bit surprising that both EEM and the Qs optimize with an N day value of 7 and the Qs generate one more trade than the EEM during the 6 month backtest period.
Both the Qs and EEM have eerily similar equity curves and linearity values. The Qs produce 16% more P&L gain and this may be traced to my tightening of the N day stop to 7, while I let the EEM ride out to 9 days. The Qs have a habit of acting a bit more squirrelly than the EEM so I'm inclined to rein it in as much as possible. One result of this short stop is that whereas the EEM pair generated all long EEM signals, the Qs variation produces 6 longs and 2 shorts.
After we examine the metrics of all 4 components we'll check the alignment of the signal dates to see how much deviation from SPY momentum can be detected. This is the process I term "basket weaving" and was explored previously with the FXY PDQ model.
Tomorrow we'll look at the DBC.
Wednesday, June 09, 2010
A Glimmer of Hope

However, just a quick look at XLE, XTO and XOM shows an almost identical technical pattern with DVN other than the LR30 channel . . . they're all looking like the next move is down.

OK, I could bore you to tears with the rest of the ill-fated tale of the Indonesian World Trade Center, but I won't. Instead, we'll just note the little pullback in the dollar that Project Z saw coming. While this certainty doesn't qualify for "reversal" status, a continued short term pull back may provide a lower risk opportunity for chasing the dollar further. And, while GLD also hit a little speedbump, NEM was on a tear as it looks poised to revisit it's mid-May high . . a feat GLD has already achieved.
Friday, May 28, 2010
Hedge Fund Favs - Part 3

The AB sort of 18 stocks reflects a wide spectrum of sectors: financial, health, tech, oil, manufacturing and retail.
My next project (as times allows) is to compare both the short and long term returns of a pairs model that plays HFT(hedge fund top)18 against the Dow30.
The other intriguing possibility is to trade the group as a basket using the Project Z algorithm. The problem with both of these situations is that they would be very capital intensive and incur a boatload of commission costs using my old reliable Schwab platform and commission schedule. The solution is easy: I just need to convince I-Shares or Schwab or ? to create a new ETF using these 18 stocks and then to periodically adjust the ETF components to reflect the latest GS report.

Wednesday, May 19, 2010
BAC-up Time?

Days like today can be instructive if you keep track of what stocks/ETFs make the first break when the NYAD finally turns positive. BAC and SMH are a couple of nuggets that I've been tracking for a while and so far today they've both demonstrated some gusto.
The chart above is my spin on support/resistance lines as well as a 50% trendline that seems to be a historical turning point.
Below is Project Z's take on BAC with a 78% reliability over the past 16 months. Not exactly a barn burner, but that's 78% long and shorts with only 1 consecutive loser on both sides so, for me, that's a keeper. This is the signal as of 10AM PST today.
The linear regression lines are still convincingly bearish so I'm actually standing back on this one until I get some more confirmation of the NYAD slope really turning positive.
Meanwhile, GE, after a early slide, is back in the green and, as I mentioned yesterday . . that's good.

Monday, May 17, 2010
DBC Doldrums & XLE: The Oily Hope

The hands down loser, as has been the case for a number of days, was DBC as global worries have significantly impacted commodity prices, especially metals which suffered a recent double whammy as a result of new hefty mining tax regulations in Australia and elsewhere.
Every night I routinely run through the actual charts of the Rotator components just to see if I agree with MLR 6 sort criteria ranking. Many times I don't and although I'm nearly a genius it usually turns out the next day that the software was correct and my feeble old brain was wrong . . which is why I keep looking at the Rotator.
Nevertheless, I'm a true glutton for punishment and the chart that caught my attention today was the XLE, which sure looks to be chattering against a clear lower support line. We made good money for the past 6 months playing a 57 butterfly but that position was exited a week ago . . dead on 57 and we are currently flat XLE.

Monday, January 25, 2010
Monday VIXology
Just for comparison sake I've shown the daily bars (above) and weekly bars (below) for a few select ETFs. The big news, hands down, was the 55% pop in the VIX last week, accompanied by a sudden appearance of volume, which helped cascade the majors through the lower LR30 lower bands. For the week: IWM down 4.5%, Qs down 4.8% and SPY down 5%.
This is the first major violation of the weekly LR30 band since the late 08 recovery began and we are now faced with the possibility of a "kiss the channel good-bye" scenario and a variety of yet to be defined support levels.
Previous uber enthusiastic surges in the VIX have exhibited a 3 day span and then displayed a 10-15% pullback and that's that's probably worth a small side bet. Other than that, I'm on the sidelines, busy refining Project Z parameters and deconstructing the PDQ Dashboard to fathom why it exited the long VXX position on Wednesday's close and left a lot of money on the table.